Facebook
 X
X
 Pinterest
 Copy Link
Thank you Sandy Dodge at Windermere for writing this post about the impact Windermere offices are making on their local communities!
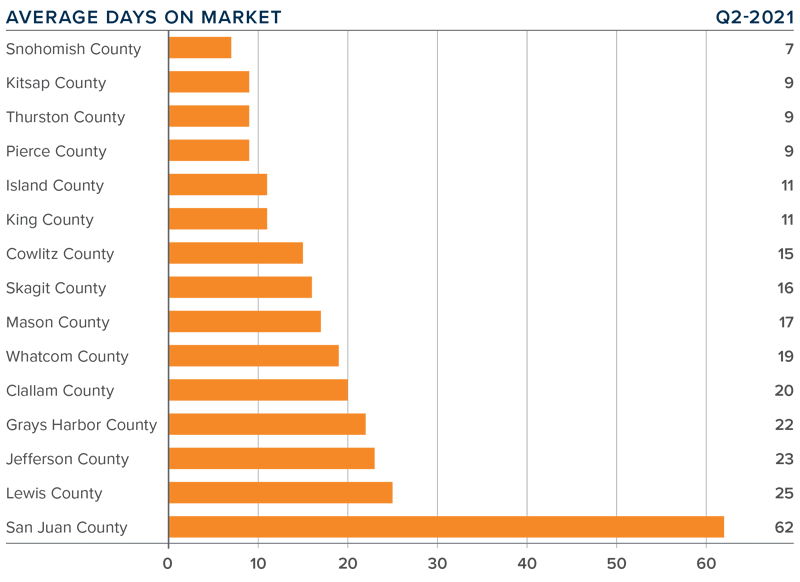
Windermere offices across the Western U.S. have remained committed to serving their communities in 2021, collectively raising nearly $1.5 million so far this year alone, pushing the foundation’s grand total raised since 1989 to nearly $45 million. After a successful Community Service Day in June and a first half of the year which saw over $1 million raised, Windermere offices have continued to give back this summer. Here are some recent highlights from across our network.
Windermere Utah
Windermere Utah has always been deeply rooted in its community, and 2021 has been no different. This year alone, they have hosted multiple fundraisers and supported several organizations to affect positive change in their community.
One of the greatest challenges the COVID-19 pandemic has put on schoolchildren is access to technology. After searching for a way to provide digital access to local schoolchildren, Windermere Utah came across the organization Spy Hop, based in Salt Lake City. Spy Hop is a digital media arts center that provides classes in film, music, audio, and design for students between the ages of nine and nineteen. They offer mentoring and host technology drives to provide computers for students in need through a program called the Technology Liberation Project. Windermere Utah donated $3,000 to support Spy Hop’s programs while sponsoring their technology drive in August.
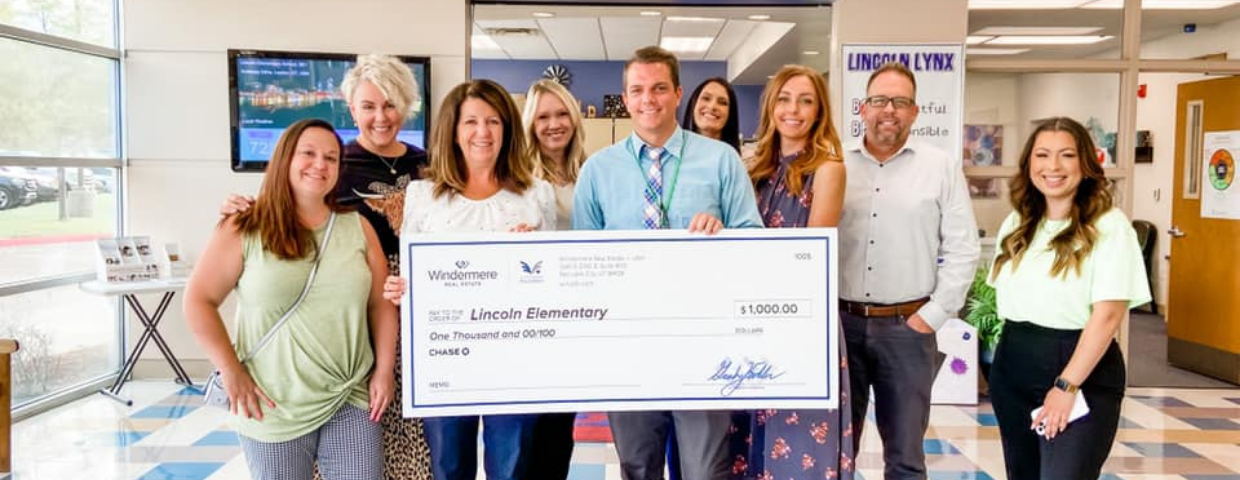
The office also rallied together to support Lincoln Elementary School. As a Title I school, they cannot ask for supplies or funds, often leaving them underfunded compared to other schools in the area. Windermere Utah donated $1,000 for kids to purchase the supplies they need for the school year.
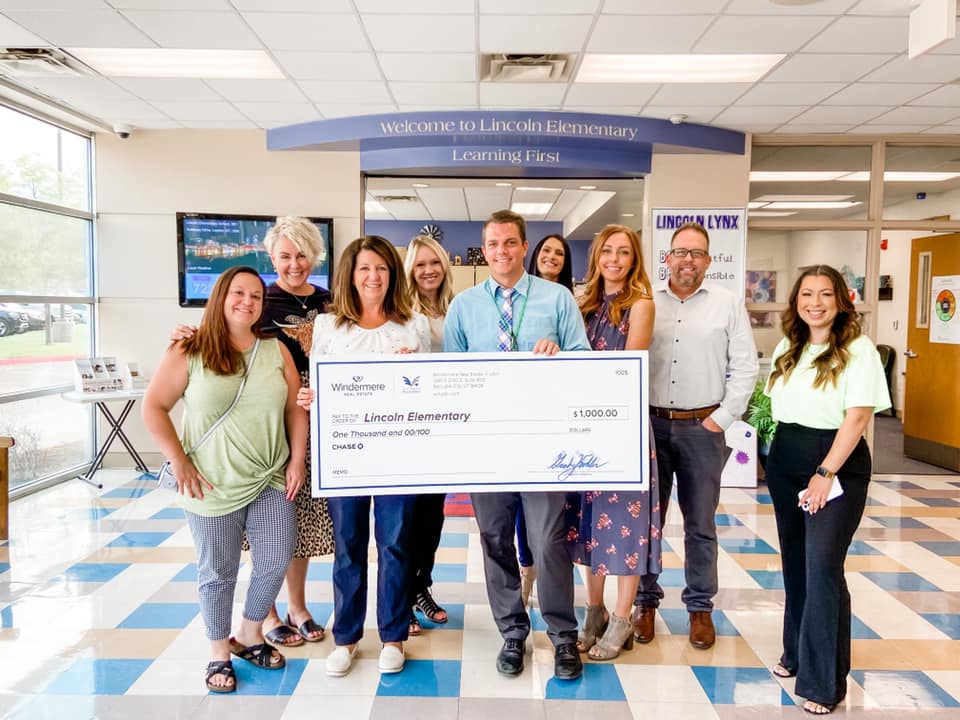
From Left to Right: Misty Medina, Laurann Turner, Lincoln Elementary Rep, Shawnee Cooper, Lincoln Elementary Rep, Michelle Adkins, Chelle Preslar, Kelly Silvestor, and Stephanie Vera
Windermere Evergreen – Evergreen, CO
Windermere Evergreen has close ties to the local Rotary Wildfire Ready program and given the prevalence of wildfires across the Western U.S. in recent years, the office was inspired to tap their Foundation resources to support local wildfire relief efforts. John Putt–managing broker at Windermere Evergreen—is a member of the Rotary Wildfire Ready leadership council. A former paramedic and firefighter, he is passionate about providing resources and education to mountain communities regarding wildfire preparedness. After trying to come up with ways to support the program, they settled on a classic method of bringing the community together—a good old tailgate party. The office donated $1,000 to support the Rotary Wildfire Ready program, and the first annual Windermere Foundation Tailgate Party saw members of the community come together from all corners of town.
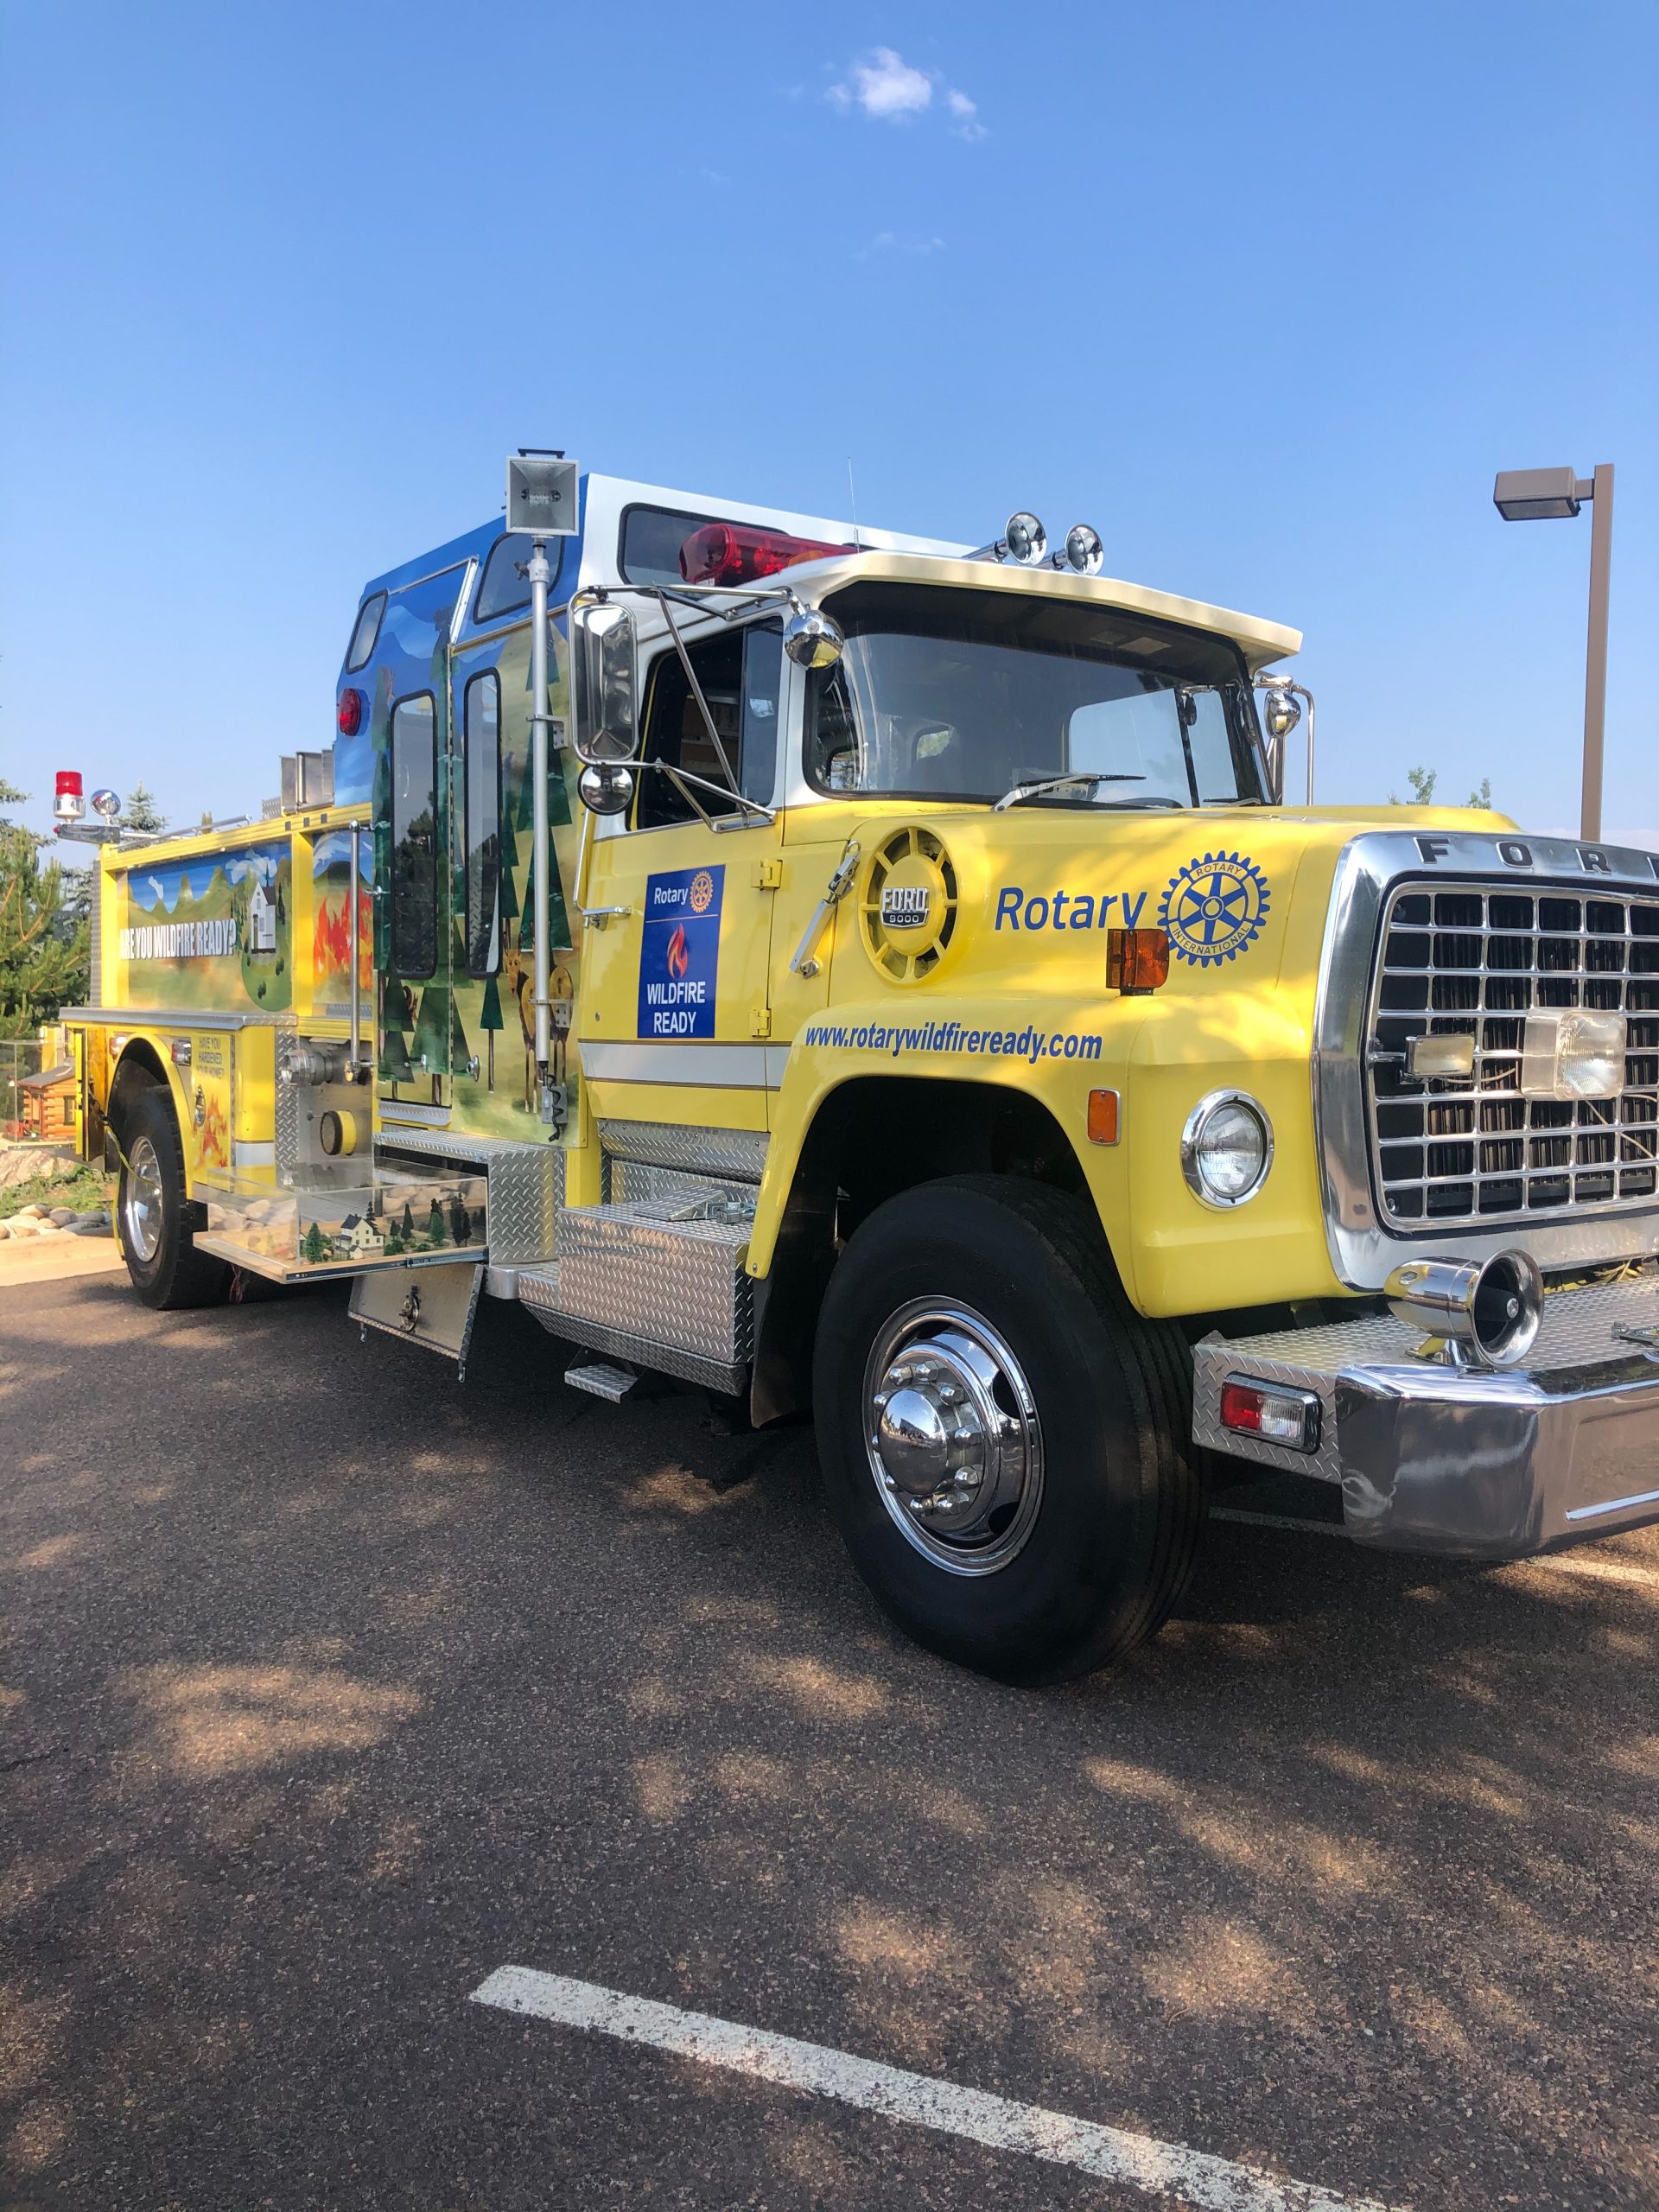
The Evergreen, Colorado Rotary Wildfire Ready firetruck.
Windermere Spokane – Spokane, WA
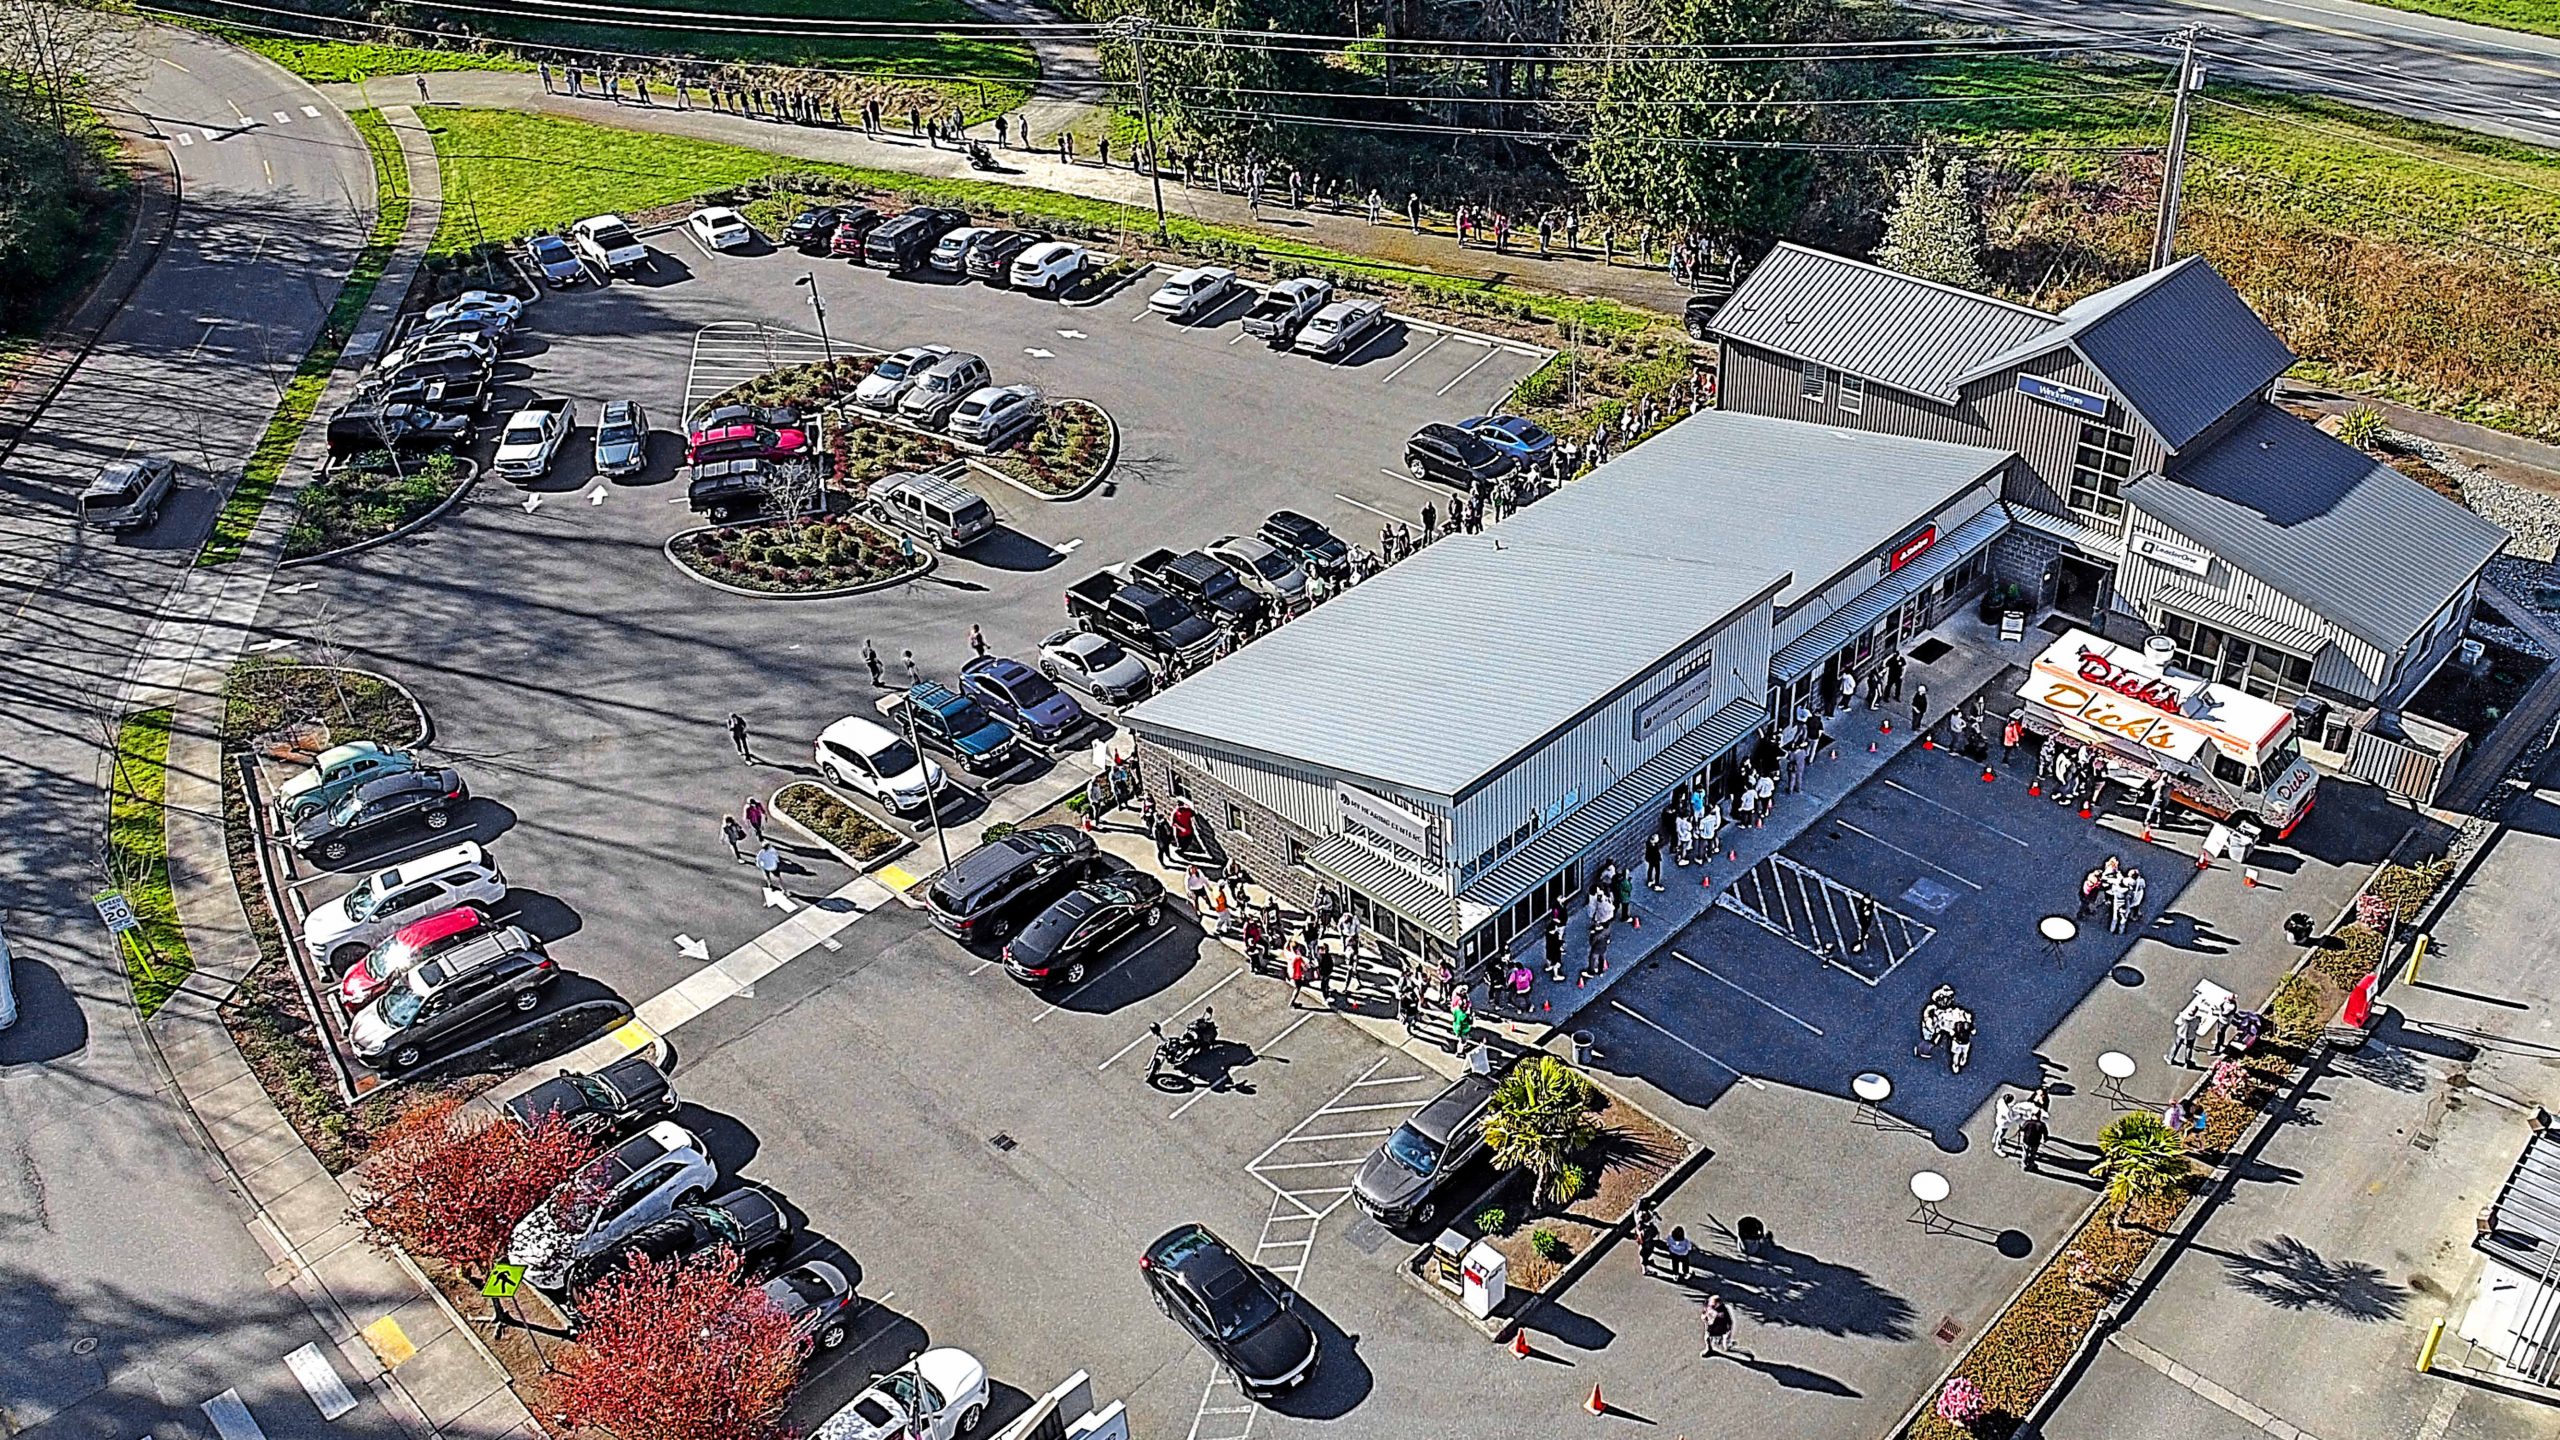
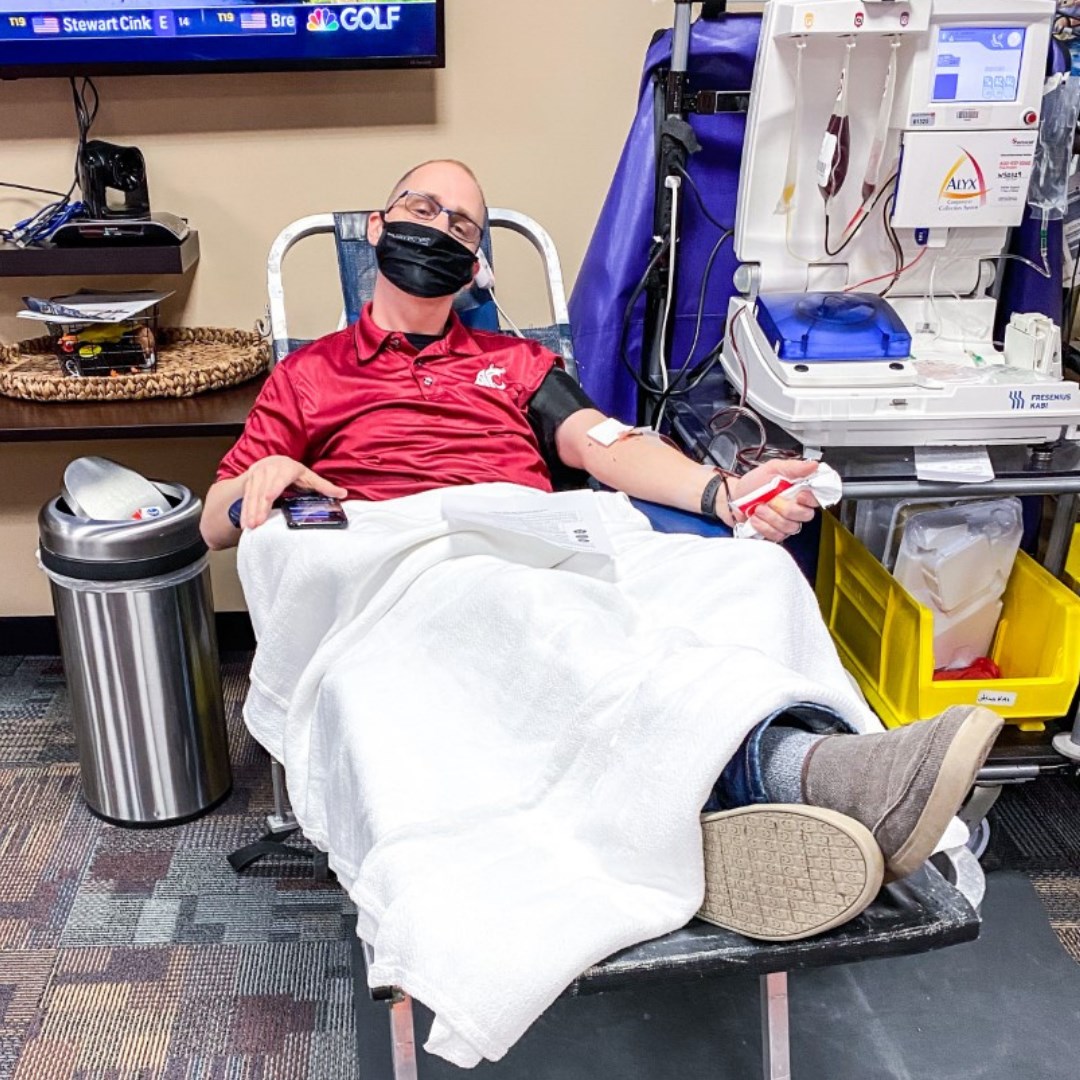
After hosting a blood drive earlier this year, Windermere Spokane has continued to find ways they can provide for those in need in their community. In early September, they turned their attention toward Spokane’s youth. When they saw the Spokane branch of Volunteers of America announce that they were planning to move their Crosswalk Youth Shelter across town to a new facility, the office jumped at the opportunity to help. Windermere Spokane held a matching fundraiser that ultimately raised over $21,000 for the new shelter. But the office’s recent foundation efforts didn’t stop there.
In preparation for the new school year, the office held their Spokane Sock and Shoe Event to support local low-income and homeless grade school-aged kids with new pairs of shoes and socks. This year’s event provided new shoes and socks for 116 kids.
Left to Right: Windermere agents Blythe Thimsen and Brenda McKinley
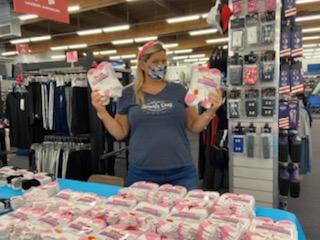
Windermere agent Brenda McKinley
Kritsonis Lindor Team — Windermere Bellevue South – Bellevue, WA
Windermere agents John Kritsonis and Karl Lindor of Kritsonis Lindor have been strong supporters of the Issaquah Food & Clothing Bank in years past, but the continued challenges of the COVID-19 pandemic made it clear that the IFCB needed their support more than ever. After food insecurity for children in their county jumped 54% in 2020, John and Karl knew they had to go all-in for their community. They doubled down on their fundraising campaign with a $25,000 match, ultimately raising $55,958. On August 20, their team spent the day volunteering at the food bank, putting together produce bags, and passing out groceries to families. All in all, they were able to provide groceries to over 120 families and over 350 kids. Their donations will support IFCB’s summer lunch program, which feeds roughly 300 children weekly during the summer.
To learn more about the Windermere Foundation, visit windermerefoundation.com. To help support programs in your community, click the donate button below.